|
|
|
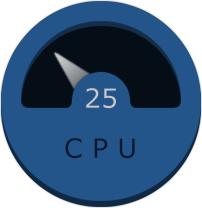
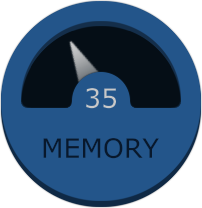
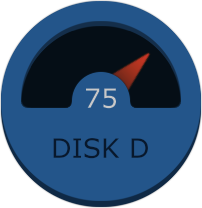
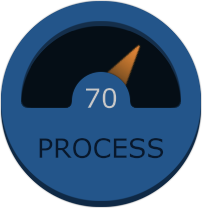
A free CPU, disk, memory and process meter for your Windows desktopA free CPU meter for your desktop, along with three more dials for memory, disk partition and process usage. This utility can continuously and simultaneously monitor these key computer parameters, displaying them on big dials for easy observation, as numeric percentage and analog hand rotation. It also offers you general information about your microprocessor (brand, type, speed), memory and disk (physical and logical drive). A process running on your computer can be selected for monitoring, and its CPU usage is computed as an average value from all processor cores data. So, with this free utility it's very easy to have a dynamic overview of your computer's performance, using a very small amount of its resources. The program's small window can be dragged anywhere on your screen and placed on top of other programs, with the opacity you have chosen.
|
|
|
Requirements- Windows XP SP3, Windows Vista, Windows 7, Windows 8, Windows 10, 32-bit or 64-bit editions - 800 x 600 px display with 16-bit graphics adapter or better - 9MB RAM and 1.2Mb on a disk drive - 1GHz or faster processor - Desktop computer, laptop or tablet PC Due to the code optimization, it does not significantly load the processor (under 1% on Intel 2Ghz). For slower computers, 'smooth motion' and 'show percentage' can be disabled in order to decrease the load.
|
|
|
|
Settings
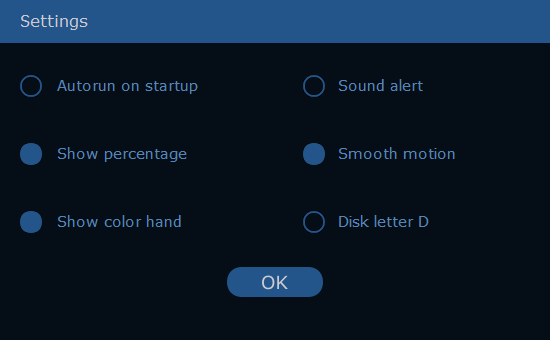
Autorun feature allows the application to be automatically launched on Windows start. Show percentage can enable or disable the numeric percent displaying in dial center. Show color hand can enable the color hand, orange over 50% and red over 75%. Sound alert, if enabled, generates a short beep on the 75% transition. Smooth motion allows the hand movement to be updated with 10 frames per second. Disk letter shows the currently selected disk partition (logical drive). It can be changed from C to Z with left button clicks and backwards from Z to C with right button clicks. You may also use the keyboard letters.
|
|
|
|
Process usage
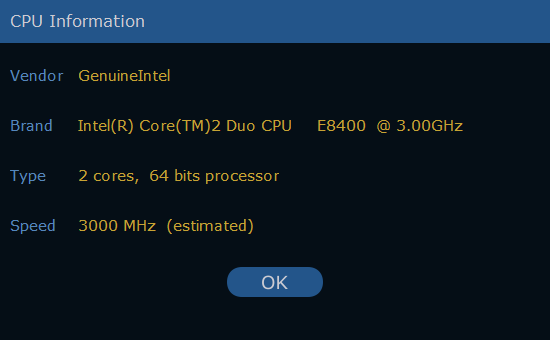
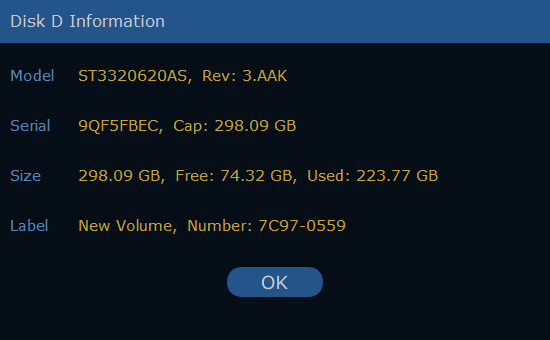
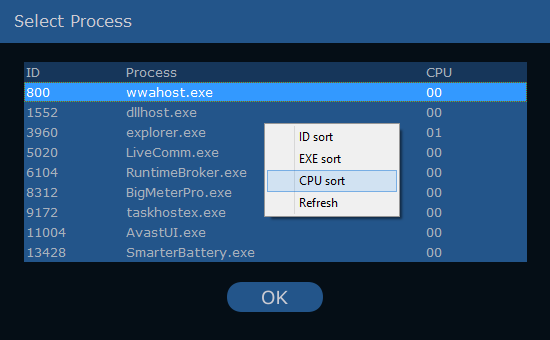
If selected, a window containing the list of running processes is displayed (no local, system and network services). You can sort them by clicking on any column's title or using the right mouse button menu, refresh them or finally select the one to be monitored. Its name will appear in the tray icon hint. CPU information This displays basic processor data: Vendor and Brand identification is available on modern Intel and AMD processors. Type: a system data showing the number of cores (threads for hyper threading models), and the 32 or 64-bit processor architecture. Speed: a software computed value of the processor speed, normally equal to the manufacturer's specifications; it may differ if the speed stepping function is activated. Memory information The total and free amount of Physical memory is displayed on this page, as well as the PageFile and Virtual memory values. Disk information First two lines of this window contain data about the physical disk hosting the currently selected partition, while the next two show data about the logical volume. It works on Hard Disks (HDD), Sold State Disks (SSD), Flash Drives, regardless of their interface type. Model, Serial, Revision and Capacity are read directly from the selected disk, using several methods. The strings can be meaningless for some old hard disks, and the data here may be different if this utility is started with "Run as Administrator" option. For the logical drive, Size, Free and Used space are displayed (in GB units) along with its volume Label and serial Number.
|
|
Features
|

