WinDraw
A function graphing utility
This software utility can plot regular or parametric functions, in Cartesian or polar coordinate systems, and is capable to evaluate the roots, minimum and maximum points as well as the first derivative and the integral value of regular functions. Easy to use, ergonomic and intuitive interface, large graphs are only a few of the program features, allowing any user, from students to experts, to have a nice experience dealing with this chapter of mathematics. Moreover, the interface language can be selected from English, French, Spanish and Romanian, for now. Several examples to test are delivered along with this utility and they can be found in the Functions folder.
The function to plot can be entered in the bottom field of the program window. It uses a Pascal-like syntax, and the function formula is case insensitive. A single variable function F, with the real argument x, may include almost all the mathematic operations and functions, and it is computed obeying the well known order of operations. If parametric function is enabled, a new field for function G is displayed underneath the F's one. Notice that both function types use the same x variable for simplicity, no matter the coordinate system you have set. A new function can be plotted over the old one (if it wasn't cleared), when the scaling setting isn't automatic.
How it works
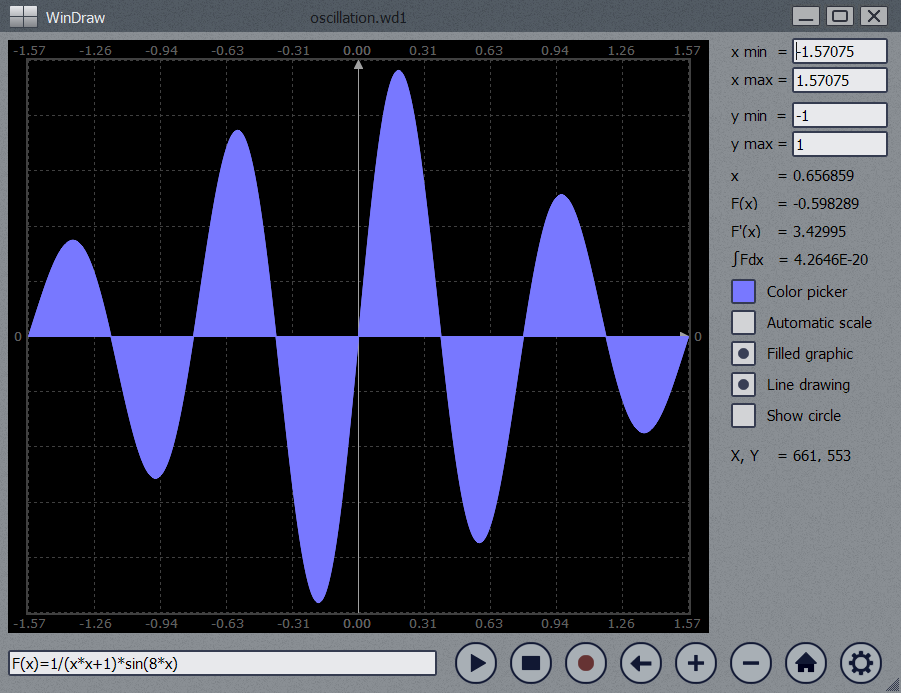
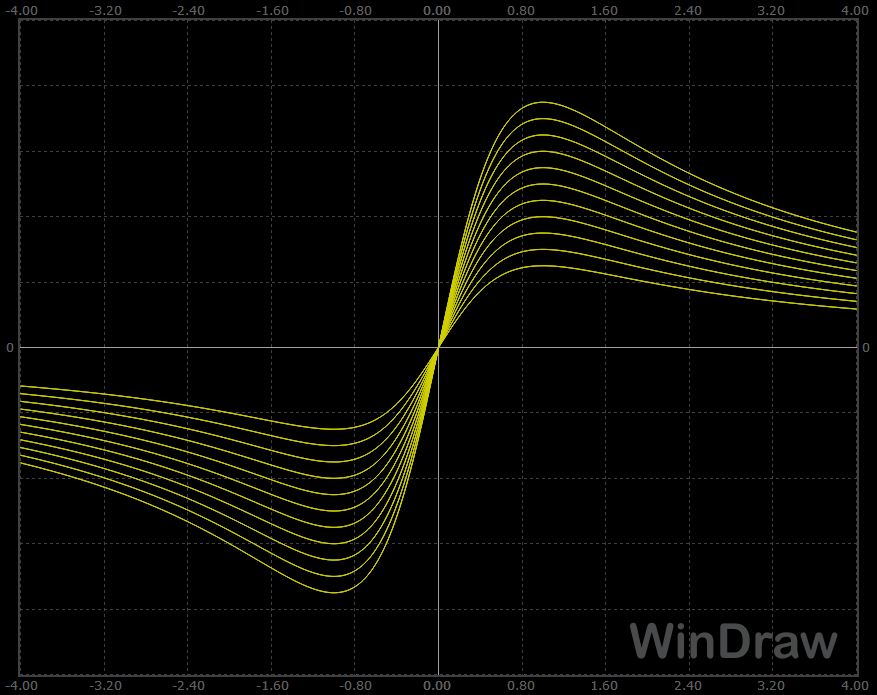
Regular functions, Cartesian coordinate system case:
The function F of one variable x, real value, is computed and displayed on the domain x min...x max, having X samples in this interval (entire X axis - horizontal). The vertical axis has Y samples, corresponding with the y min...y max domain. If Automatic scale is enabled, y min and y max are automatically computed and so they can no longer be edited. The current point on X axis is determined by the horizontal mouse position inside the graphic area, and it can be displayed as a circle, if enabled. The x,F(x) coordinates are computed on mouse movements over the graphic, as well as the first function derivative in the current point. For the x domain you have entered, the integral value is also numerically computed and displayed in the right side of the program window. In this case, the graph can have some visual enhancements, as a solid filling, normal and anti-aliased line drawing, darker color for the negative points and areas.
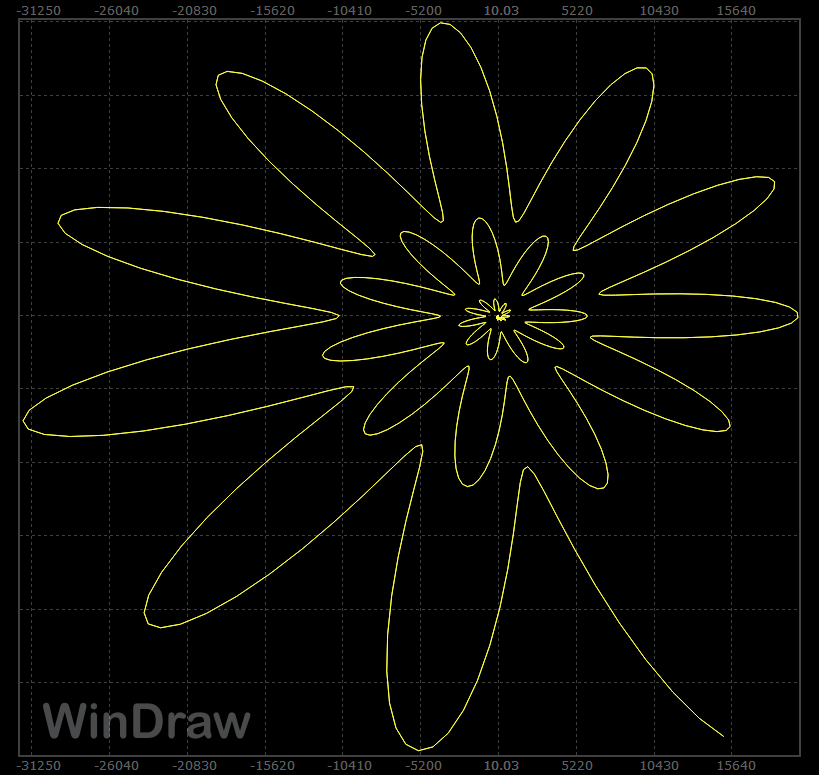
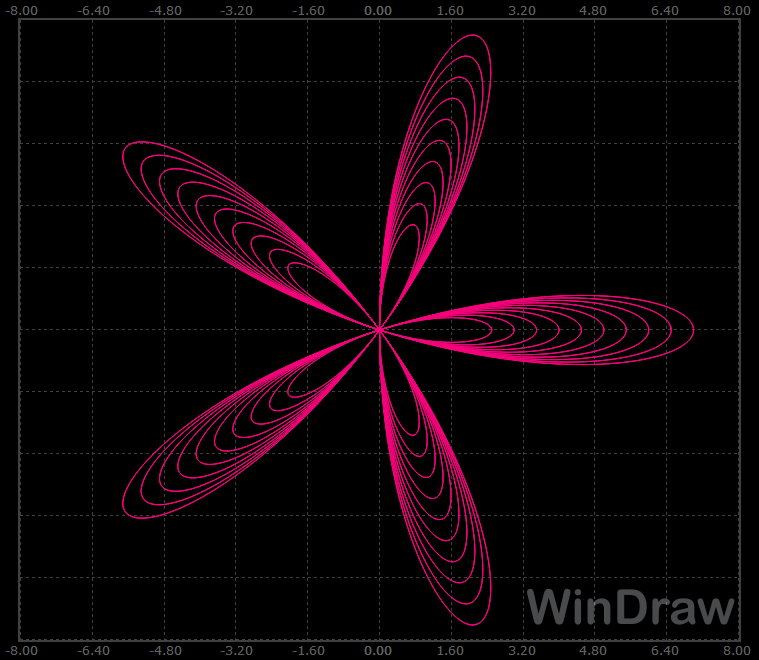
Regular functions, polar coordinate system case:
When polar coordinates are selected, the x argument gets Z values in z min...z max domain, representing the angle to the horizontal axis, in radians. The function value for this angle gives the distance from the pole, and so these polar coordinates set a point in x min...x max and y min...y max domains. Automatic scale adjusts the graph size to the minimum and maximum values of the function F. The current point of the graph can be displayed as a circle along the graphic line and it glides forward on z domain on any mouse movement. If Ctrl is pressed, it'll glide backward on z domain. Same as before, the x,F(x) coordinates are computed and shown on mouse movements over the graphic. Filled and Darker options are not used in this case. Any regular function, having graph on either Cartesian or polar system, can be saved/loaded to/from a wd1 file. This file type embeds the formula, the x, y and z domains, plus some display parameters (color, filling, lines...).
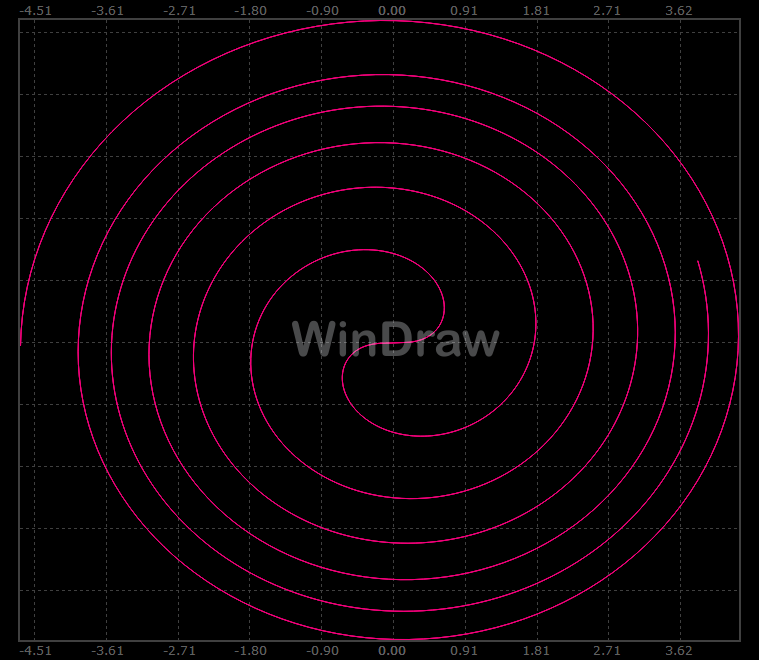
Parametric functions, Cartesian coordinate system case:
A system of two functions F and G, of the same real argument (parameter) x, can be graphically represented as a curve from their values which are corresponding to points in the XY axes system. To keep the things simpler, the x argument also gets Z values in z min...z max domain. If Automatic scale is enabled, the graphical x and y domains are automatically computed and so they can no longer be edited. The current point of the graph can be displayed as a circle along the graphic line and it glides forward on z domain on any mouse movement. If Ctrl is pressed, it'll glide backward on z domain. Same as before, the x value and F(x),G(x) coordinates are computed and shown on mouse movements over the graphic. Filled and Darker options are not used in this case.
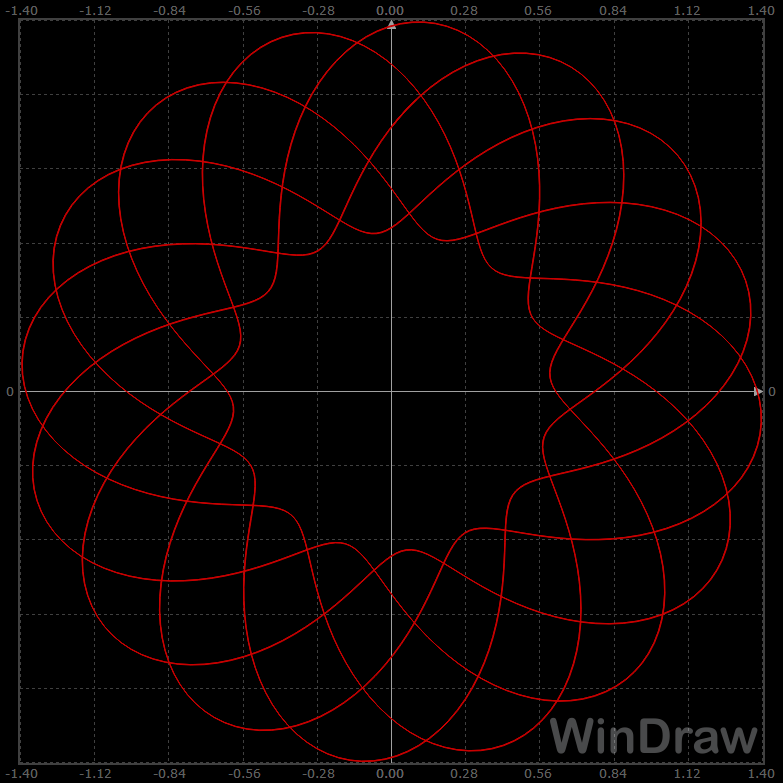
Parametric functions, polar coordinate system case:
This case is similar with the previous one, the only difference is that the F(x),G(x) values are now polar coordinates for the graphic representation. Filled and Darker options are not used in this case. Any set of parametric functions, having graph on either Cartesian or polar system, can be saved/loaded to/from a wd2 file. This file type also embeds the formulas, the x, y and z domains, plus some display parameters (color, filling, lines...).
Rules to write a function
The function's formula may contain up to 9 levels of parentheses and maximum 100 constants. All the trigonometric functions are considered with their arguments in radians. The order of operations is the standard algebraic left to right of:
-
Functions
-
Parentheses
-
Exponents
-
Unary minus
-
Multiplication, division
-
Addition, subtraction
Any function can be loaded and saved from/to specific text files, containing the formulas, domains for graph representation and for argument, as well as some plotting parameters. The file extensions this program tries to register are wd1 for regular functions and wd2 for parametric ones. So, when this kind of files are clicked in Windows Explorer, the WinDraw utility is automatically launched and the function is plotted. Another way to open a function is to simply drag and drop its file over the program window. In order to see some functions and their graphs, just open the Functions folder from the Start Menu and click on any example file to run it. When syntax or overflow errors are generated, you'll be prompted with an error message telling you what to do next, and the function string to be edited will change color.
Settings
The first two program options configure the function type, regular or parametric, and its coordinate system. They are followed by the graphic options, which are self explanatory. For regular functions a text report can be generated, if enabled, containing function data such as formulas, domains, roots, maxima and minima, integral value. It is automatically displayed with the text associated program (Notepad, WordPad). WinDraw's default language is English, but you have several options to choose from. We will try to add other languages files as soon as possible.
Mouse and keyboard commands
The buttons located next to function's fields are self explanatory; from left to right, you have:
-
plot the current function (same as Enter in function field)
-
clear all graphs and initialize the grid
-
save displayed graphs as bitmap or jpeg picture files
-
previous function (last ten are stored)
-
zoom in on the X axis; if Ctrl is pressed, zoom in on the Y axis
-
zoom out on the X axis; if Ctrl is pressed, zoom out on the Y axis
-
this utility's web page
-
settings page
On the currently displayed graph, the mouse commands are:
-
left button allows you to move the graph on XY axis (this depends on Automatic scale setting);
-
right button pops-up a menu containing the same commands as the bottom buttons do;
-
the mouse wheel zooms in or out on X axis; Ctrl changes this to Y axis;
Other settings
Graphic options
The XY axes system has a flexible size, which can be modified by resizing the program window. Starting from 660 x 500, it can be enlarged up to 2000 x 1300 pixels. The drawing can be made of lines or dots, normal size (1pixel wide) or thick (2pixels), using a color selectable from the Color palette. Regardless of other program settings, the XY axis and the grid can be independently enabled or prevented from showing. For a higher contrast during presentations, we have added the White background option for the displayed graphics.
Language
Four unicode text files are located in program's folder, one for each available language. The file lang_eng contains the program menus, messages, titles in plain English, and this could be useful for anyone willing to translate it to a new language. Notice that the text structure and the number of lines should be kept as in this document, as well as the logic and the meaning of some consecutive lines. Moreover, all the lines have to be short, in order to fit their program spaces. Do not hesitate to share them with us for a possible inclusion in the next releases. Also you can recommend alternate, more accurate translations for the actual language files our software has.
Registration
The trial version currently available for download has a few limitations:
- a maximum of 100 different functions may be displayed
- some texts are shown in the graphic area and in the picture files
- PrtScr function is disabled during the trial period
The current license type available for purchase is Personal, meaning that the owner is an individual using one registered copy of our utility, on a single computer at a time, for an unlimited period of time. Do not hesitate to ask us for special license pricing for larger entities (companies, schools, classes). Any future upgrades will be free for the registered users.
Features
-
fast and easy function graphing
-
Cartesian and polar coordinate system
-
several program languages
-
anti-aliased line drawing
-
simple mouse operations
-
flexible graphic window size
Requirements
-
Windows XP, Vista, 7 .. 10, both 32 or 64 bit
-
Minimum 1024 x 768 pixel screen resolution
-
Pentium III 1GHz processor and 256Mb memory
Supported functions
Variables
x, X - the real argument
pi, PI - the constant 3.14159...
e, E - the exponent part of a scientific number format
. - decimal symbol
Operators
= equals sign
+ addition
- subtraction, negation, minus
* multiplication
/ division
() [] {} parentheses (equivalent)
Functions
sin - sine of the
argument (in radians)
cos - cosine of the argument (in radians)
tan - tangent of the argument (in radians)
arcsin, asin - inverse sine of the argument, the returned value is
in radians
arccos, acos - inverse cosine of the argument, the returned value is
in radians
arctan, atan - inverse tangent of the argument, the returned value
is in radians
^ - raise to the power of an exponent.
lg, log - logarithm base 10
ln - natural logarithm
exp - Euler's constant 2.71828... raised to the power of the
argument
sqrt - square root
sinh - hyperbolic sine of the argument
cosh - hyperbolic cosine of the argument
tanh - hyperbolic tangent of the argument
abs - absolute value
int - integer part of the argument